Casablanca Weather Guide: Monthly Temperatures and Best Times to Visit
Casablanca Morocco weather is as diverse and captivating as the city itself. Nestled on the Atlantic coast, this bustling metropolis experiences a range of climatic variations throughout the year. Each month brings its own charm, influencing the city’s rhythm and the activities of its residents. If you’re planning to visit Casablanca, understanding its weather nuances is crucial. In this detailed guide, we’ll delve deep into the monthly variations of Casablanca’s climate, ensuring you’re well-prepared for a visit any time of the year.
Casablanca city’s average temperature ranges from 13°C (55.4°F) in January to about 28°C (82.4°F) in August. Most times, the summers are warm, muggy, arid, and clear. During winter times, it is usually cool and partly cloudy. The temperature throughout the year usually ranges from 13°C (55.4°F) to 26°C (71.6°F). It rarely goes below or above these temperatures.
average temperature Casablanca by season
In the following section, we will detail the average temperatures of Casablanca by season, presenting the data in both Celsius and Fahrenheit (°F) for clarity and convenience. Let’s explore the city’s temperature trends throughout the year.
Winter (December – February)
In the winter months of December through February, Casablanca experiences cooler temperatures. The average high during this period is approximately 18°C (64.3°F), while the average low hovers around 9.4°C (49°F). Rainfall is more frequent in these months, with January seeing the highest number of rainy days.
Spring (March-May)
Spring in Casablanca, spanning March to May, sees a gradual rise in temperatures. The average high temperature for these months is about 20.6°C (69°F), and the average low is around 12.8°C (55°F). April tends to be the driest month of the season, with only 5 days of rain.
Summer (June – August)
Summer months, from June to August, are the warmest in Casablanca. The average high temperature during this season is roughly 25.6°C (78°F), and the average low is about 19.4°C (67°F). Remarkably, rainfall is almost non-existent in these months, with zero rainy days recorded for June, July, and August.
Autumn (September – November)
Autumn, covering September to November, brings a slight drop in temperatures. The average high for this season is around 23.5°C (74.3°F), and the average low is approximately 15.6°C (60°F). Rainfall begins to pick up again in November, marking the transition into the wetter winter months.
To summarize, Casablanca experiences distinct seasonal variations in its climate. Winter months are colder with more frequent rainfall, while spring introduces a gradual warming trend. Summer stands out for its warmth and notably dry conditions, and autumn signals a transition with decreasing temperatures and the return of rainfall. Presented in both Celsius and Fahrenheit, this data offers a comprehensive insight into the city’s annual temperature fluctuations, aiding residents and visitors in understanding and preparing for the city’s diverse weather patterns.
Average temperature Casablanca by month
Casablanca, with its coastal location, offers a range of temperatures throughout the year. From the cooler embrace of winter to the sun-kissed days of summer, each month presents its unique climate. Let’s explore the monthly temperature variations to understand what this vibrant city offers.
| Month | High (°F) | Low (°F) | High (°C) | Low (°C) | Rain |
|---|---|---|---|---|---|
| January | 63° | 48° | 17.2° | 8.9° | 7 days |
| February | 64° | 49° | 17.8° | 9.4° | 6 days |
| March | 67° | 52° | 19.4° | 11.1° | 6 days |
| April | 68° | 54° | 20° | 12.2° | 5 days |
| May | 72° | 59° | 22.2° | 15° | 2 days |
| June | 75° | 64° | 23.9° | 17.8° | 0 days |
| July | 79° | 68° | 26.1° | 20° | 0 days |
| August | 80° | 69° | 26.7° | 20.6° | 0 days |
| September | 78° | 66° | 25.6° | 18.9° | 0 days |
| October | 75° | 61° | 23.9° | 16.1° | 4 days |
| November | 70° | 54° | 21.1° | 12.2° | 6 days |
| December | 66° | 50° | 18.9° | 10° | 7 days |
January
The first month of the year sees average high temperatures of 63°F (17.2°C) and lows of 48°F (8.9°C). Rainfall is relatively frequent, with seven days of precipitation.
February
Temperatures in February slightly increase, with highs averaging 64°F (17.8°C) and lows at 49°F (9.4°C). The city experiences rain for approximately six days.
March
March witnesses a further rise in temperatures, with highs around 67°F (19.4°C) and lows of 52°F (11.1°C). Rainfall remains consistent with six days of rain.
April
In April, the temperatures continued their upward trend, reaching highs of 68°F (20°C) and lows of 54°F (12.2°C). Rainfall decreases slightly with five days of precipitation.
May
May marks the onset of warmer days, with average highs of 72°F (22.2°C) and lows of 59°F (15°C). Rain is less frequent, occurring in just two days.
June
June sees a significant rise in temperatures, with highs averaging 75°F (23.9°C) and lows at 64°F (17.8°C). It’s a dry month with no recorded rainfall.
July
The peak of summer in July brings highs of 79°F (26.1°C) and lows of 68°F (20°C). The weather stays dry without any rainy days.
August
August is the warmest month, with average high temperatures reaching 80°F (26.7°C) and lows at 69°F (20.6°C). Rain is absent during this month.
September
As autumn approaches, September experiences highs of 78°F (25.6°C) and lows of 66°F (18.9°C). The dry spell continues with no days of rain.
October
October sees a drop in temperatures, with highs averaging 75°F (23.9°C) and lows at 61°F (16.1°C). Rain returns, falling on an average of four days.
November
In November, the temperatures further decrease to highs of 70°F (21.1°C) and lows of 54°F (12.2°C). The city has witnessed rain for six days.
December
Closing the year, December has average high temperatures of 66°F (18.9°C) and lows of 50°F (10°C). Rainfall is relatively high, with seven days of precipitation.
This chart displays the monthly average temperatures throughout the year.
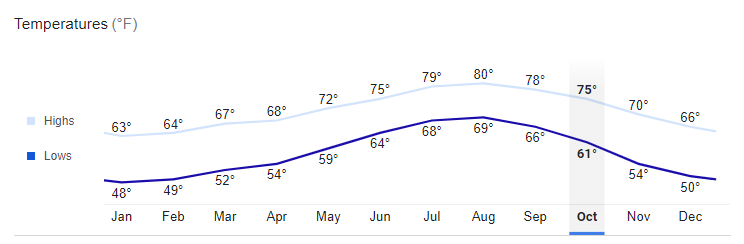
This overview provides a comprehensive understanding of Casablanca’s monthly temperature variations, highlighting the city’s transition from cooler winter months to warm summers and back.
Daylight Duration In Casablanca
Casablanca, the city of sun, boasts an impressive average of over 12 hours of daylight throughout the year. With such abundant sunlight, it’s no surprise that the daylight duration rarely dips below 10 hours, making it a sun-soaked destination for most of the year.
January
In January, Casablanca experienced approximately 10 hours of daylight.
February
February sees a slight increase, with the city basking in about 11 hours of sunlight daily.
March
March marks the onset of longer days, offering around 12 hours of daylight.
April
By April, the days have lengthened further, providing 13 hours of sunlight.
May
May continues the trend with a radiant 14 hours of daylight.
June
In June, the days are the longest of the year, averaging about 14.5 hours of sunlight.
July
In July, the days are still long but decrease slightly to 14 hours of daylight.
August
In August, the days shorten to about 13.5 hours of daylight.
September
September offers around 12.5 hours of daylight, signaling the transition towards shorter days.
October
October brings with it 11.5 hours of sunlight each day.
November
In November, as the year progresses, the days shorten to around 10.5 hours of daylight.
December
Closing the year, December mirrors January with approximately 10 hours of daylight.
Below is a chart illustrating the daylight duration in Casablanca.
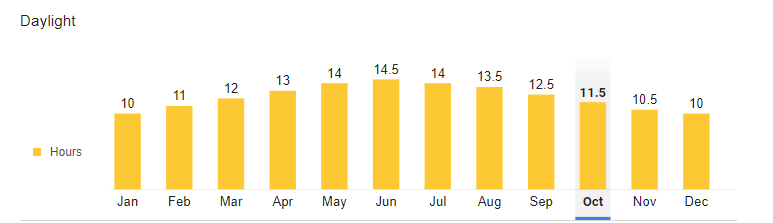
Throughout the year, Casablanca remains a luminous destination, with its generous daylight hours reflecting its sunny disposition. Whether you’re a resident or a visitor, the city ensures ample sunlight, enriching daily life and activities.
What is the best time to visit Casablanca?
When considering the best time to visit Casablanca, the tourism score favors clear, rainless days with perceived temperatures between 18.3°C (65°F) and 26.7°C (80°F). The best time to fully enjoy the great weather of Casablanca is from April to October. The weather is typically mild and warm during these months, with occasional rain showers. Mornings might occasionally be shrouded in mist or fog. April, May, and October often have short bouts of rain, either during the day or night. Heatwaves in July, August, and September are infrequent, making them negligible in travel considerations.
For those eyeing a beach holiday in Casablanca, the prime window extends from July to September, possibly stretching into the first half of October. This interval promises delightful warm weather, perfect for beach activities. The beach pool score is highest during clear, rainless days with perceived temperatures between 24°C (75°F) and 32.2°C (90°F).
August stands out as the warmest month in Casablanca, boasting average temperatures of around 26.1°C (79°F) and lows of 21.1°C (70°F). The city’s warm phase lasts approximately 4-5 months. Conversely, the colder season spans about 3-4 months, typically from December to March, with daily averages seldom exceeding 18.9°C (66°F). January is often the chilliest month, with temperatures averaging around 9.4°C (49°F) for lows and peaking at about 17.2°C (63°F) for highs.
Conclusion
Throughout the year, Casablanca weather offers a diverse range of experiences, from the sun-soaked days of summer to the crisp chill of winter. This ever-changing climate not only shapes the city’s daily life but also influences the activities and events that take place. Whether you’re seeking the warmth of the Mediterranean sun or the cozy embrace of a cooler season, Casablanca’s weather caters to every preference, making it a year-round destination for travelers from all corners of the globe.
The data referenced in our discussion has been sourced from the National Centers for Environmental Information (NCEI). For those seeking a comprehensive and detailed understanding of environmental and climatic patterns, the NCEI website, available at https://www.ncei.noaa.gov/, serves as a reliable and authoritative resource. Their extensive databases and reports provide invaluable insights into various meteorological phenomena and trends.